A furniture showroom spent about 80,000 rupees on printed catalogues last season. Every page had a QR code. When the owner was asked how many people scanned them, he said what almost everyone says.
"No idea. Probably a lot?"
Probably a lot is not a number. And the frustrating part is that he could have known — exactly, down to the page and the city — for free. He just didn't add nine extra characters to the link before printing.
So let's fix that. This guide covers what QR code tracking actually is, what a free static code can and cannot tell you, and how to set up scan tracking in about ten minutes without paying anyone.
Can you track QR code scans?
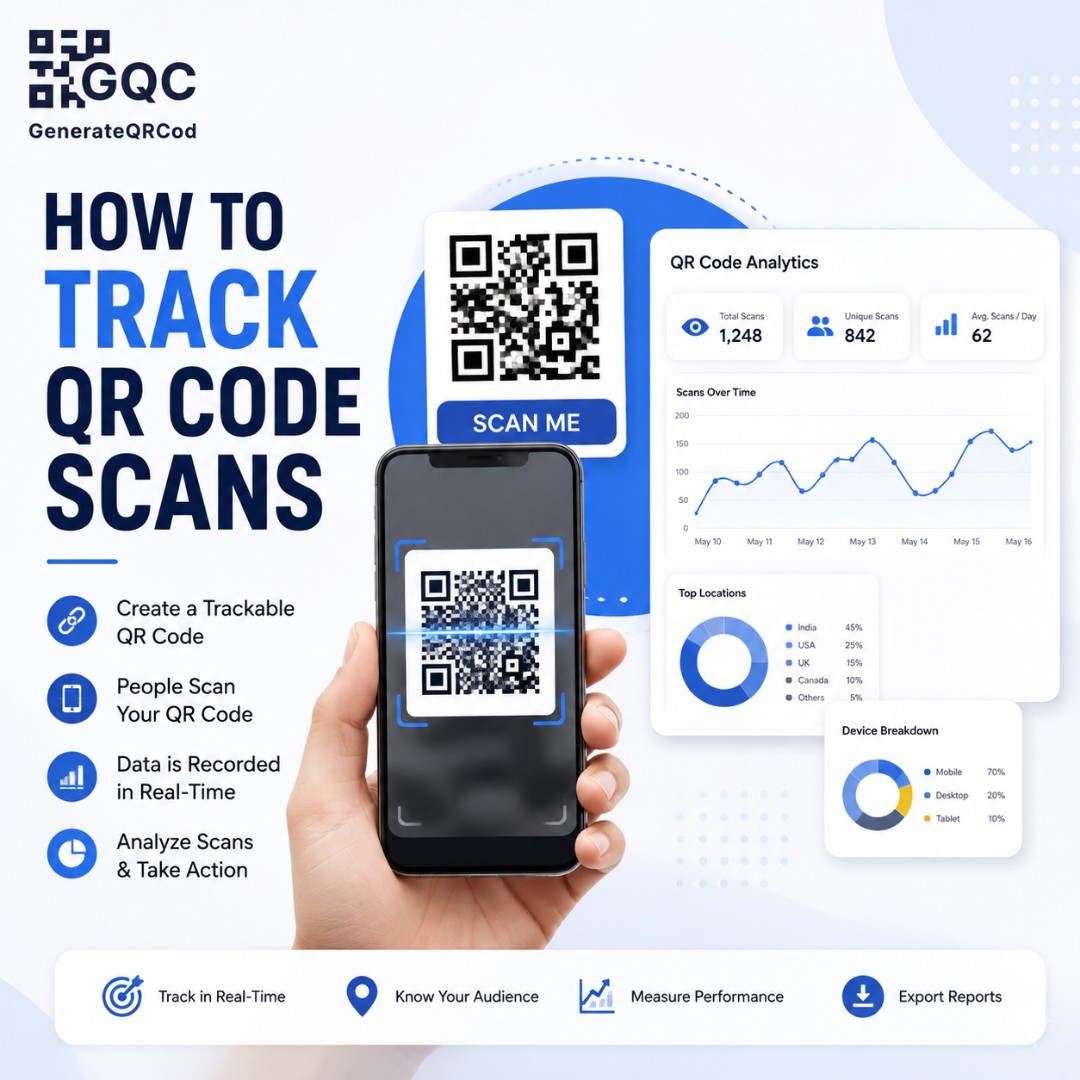
Yes, you can track QR code scans, but not inside the code itself. A QR code is just a printed link — it stores data and nothing else. Tracking happens on the destination side: either through UTM tags read by your website analytics, or through a dynamic QR code that logs every scan on a redirect server.
That distinction confuses a lot of people, so it is worth slowing down on. The black-and-white square never counts anything. It cannot. What counts is whatever sits at the other end of the link.
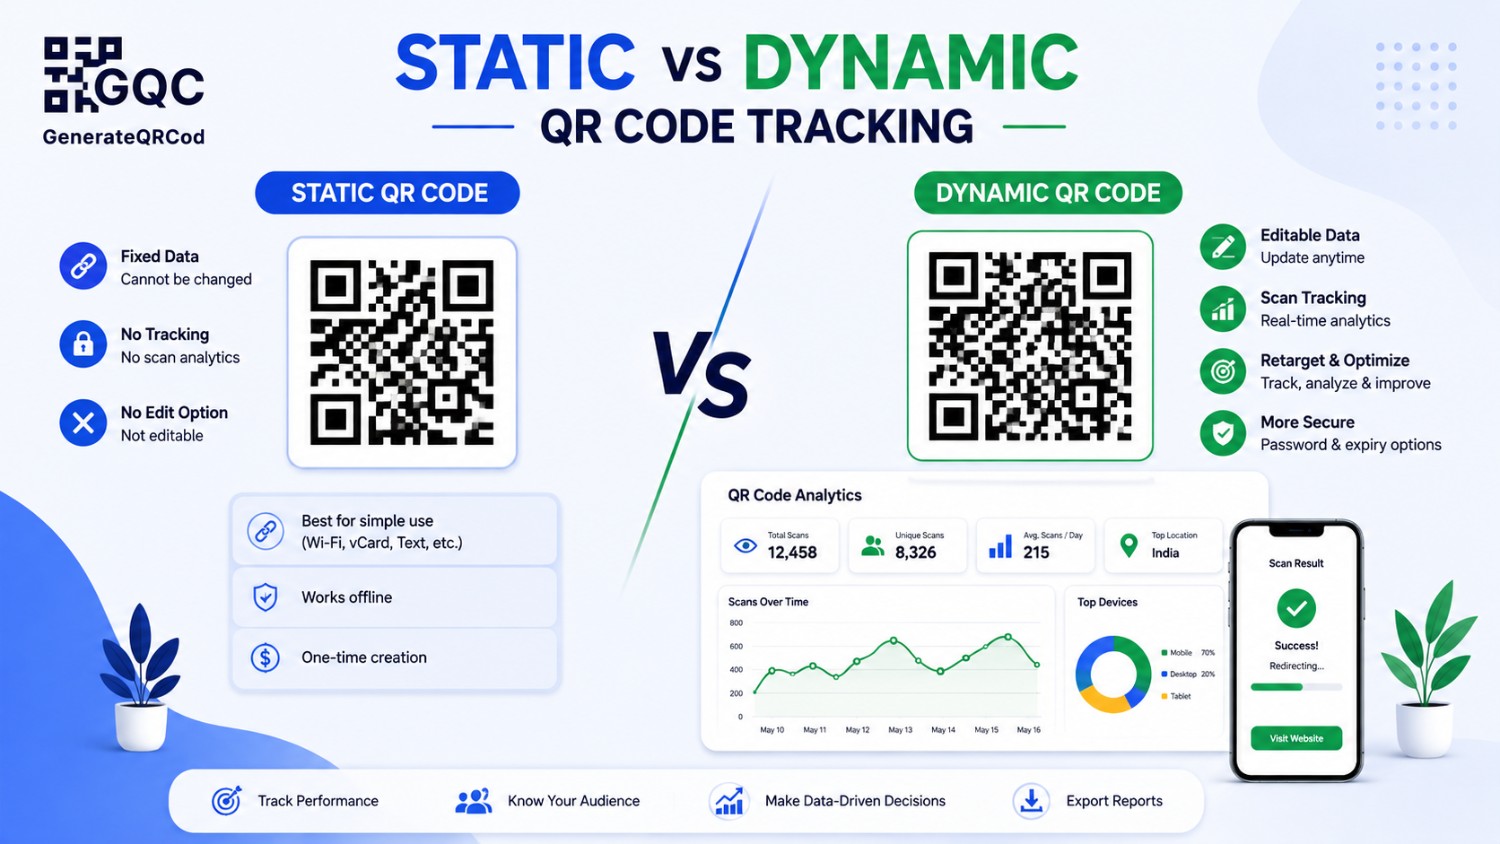
Static vs dynamic QR code tracking
Tracking question | Static QR code | Dynamic QR code |
|---|---|---|
Counts scans directly | No | Yes |
Counts website visits from scan | Yes, with UTM tags | Yes |
Shows device type (iOS/Android) | Yes, via analytics | Yes |
Shows city or country | Yes, via analytics | Yes |
Shows time and date of each scan | Only as site sessions | Yes, scan by scan |
Change destination after printing | No | Yes |
Works when the link is not a website | No | Limited |
Cost | Free | Usually paid |
The honest takeaway: if your QR code points to a web page you own, a free static code plus UTM tags gets you 90% of what a paid dashboard shows. If you need per-scan logs or the ability to change the destination after printing, that is dynamic territory. We broke the full comparison down in static vs dynamic QR code.
The free method: UTM tags on your QR code link
UTM tags are small labels you add to the end of a URL. They do not change where the link goes. They just tell your analytics tool where the visitor came from, so a scan from a table tent looks different from a scan on a delivery box.
Here is what each one does:
UTM parameter | What it records | Example value |
|---|---|---|
utm_source | Where the scan came from | qr_code |
utm_medium | The channel type | print, packaging, signage |
utm_campaign | The specific campaign | diwali_catalogue_2026 |
utm_content | Which exact placement | table_tent, page_14, box_insert |
utm_term | Optional, for variants | design_a / design_b |
A finished tracked link looks like this:
yoursite.com/offers?utm_source=qr_code&utm_medium=print&utm_campaign=catalogue_2026&utm_content=page_14
Long, yes. Ugly, also yes. Nobody sees it — it lives inside the QR code, and the customer only sees the page that opens.
How to build a tracked QR code, step by step
Step 1 — Decide what one scan should prove
Before touching a tool, finish this sentence: "This code is working if ___ happens." More menu views. More form submissions. More review clicks. If you cannot finish that sentence, tracking will just give you numbers you never use.
Step 2 — Write your UTM link
Keep it lowercase, use underscores instead of spaces, and never use the same utm_content value twice. That value is what lets you compare placements later, so be specific — box_insert beats packaging.
Step 3 — Generate the QR code from that full link
Paste the complete tagged URL into a free QR code generator, add your logo and brand colours, then download SVG for print or PNG for screens. The extra characters make the code slightly denser, which is one more reason to print it a little larger.
Step 4 — Scan it yourself first
Scan with an iPhone and an Android before it goes anywhere. Then open your analytics real-time report and confirm your own test scan appears with the right source. If it does not show up now, it will not show up later either.
Step 5 — Give every placement its own code
Same page, different utm_content. One for the counter, one for the parcel insert, one for the standee. This is the whole point. Otherwise you get one blended number and no idea what to do with it.
Where the scan data shows up in Google Analytics
In GA4, tagged traffic sorts itself automatically. You will find it in a few places:
Reports > Acquisition > Traffic acquisition: filter by Session source / medium and look for qr_code / print.
Explore > Free form: add utm_content as a dimension to compare individual placements side by side.
Reports > Tech > Device category: tells you the iOS-Android split of your scanners.
Reports > User > Demographics: gives you city-level data, useful for multi-location businesses.
Real-time report: the fastest way to confirm a new code is tagged correctly.
One warning. Analytics only records a scan if the page actually loads. Poor signal in a basement showroom, a slow page, someone scanning and immediately closing the tab — all of that goes uncounted. Your real scan number is always a little higher than what the dashboard says.
What to measure — and what to ignore
Scan count is the vanity metric everyone reports and nobody acts on. These are the numbers that actually change decisions:
Metric | What it tells you | What to do about it |
|---|---|---|
Scans per 100 customers | Whether placement works | Move the code, add a reason to scan |
Bounce / quick exit rate | Landing page mismatch | Match the page to the printed promise |
Time on page after scan | Content relevance | Trim the page, mobile-first |
Conversion after scan | Real business value | Shorten forms, add one clear CTA |
Device split | Technical issues | Test the weaker platform properly |
Scan time of day | Best print run timing | Staff prompts at peak hours |
Repeat visits | Reprint value | Keep high performers, kill the rest |
Scans vs unique scans — the number people misread
Total scans counts every scan. Unique scans counts every person. One customer scanning your menu code four times across a meal is four scans and one person.
Use unique scans to judge reach. Use total scans to judge usefulness. A menu code with a high repeat rate is not broken — it means people keep coming back to it, which is exactly what you want.
Restaurants in particular should read this alongside our QR code menu setup guide, because menu codes behave very differently from marketing codes.
A naming system so your data stays readable
Six months in, you will have forty codes and no memory of what any of them were. Fix that on day one with a fixed pattern.
Format: channel_placement_month_year — for example print_tabletent_oct26
Always lowercase, always underscores, never spaces or capitals
Keep one spreadsheet: code name, destination URL, print location, date installed, quantity printed
Add a column for scans at 30 days and 90 days so reprint decisions are based on data
It takes five minutes. It saves an afternoon of guessing later.
Mistakes that break QR code tracking
Generating the code from the plain URL and adding UTM tags afterwards — the printed code still holds the old link
Using the same utm_content for every placement, which makes comparison impossible
Sending scans to a homepage instead of a dedicated landing page
Pointing the code at a page that is slow or not mobile-friendly
Using a free short-link service that later shuts down and takes your printed campaign with it
Judging results after four days — offline campaigns need at least three to four weeks
And one that is easy to miss: if the code is too small or badly printed, your data will be low simply because people could not scan it. Check your dimensions against the printed QR code size guide before blaming the campaign.
Start tracking before your next print run
Most QR campaigns fail quietly, not loudly. They get printed, they get placed, and nobody ever finds out whether they worked — so the same thing gets printed again next season.
Add the tags. Name the codes. Check the numbers at 30 days. That is the whole system, and it costs nothing.
Create your tracked QR code free at GenerateQRCod — paste your tagged link, add your logo, download PNG or SVG. No sign-up, no watermarks. Want to see where else codes can earn their place? Read QR code benefits for business next.